Night-time light data analytics
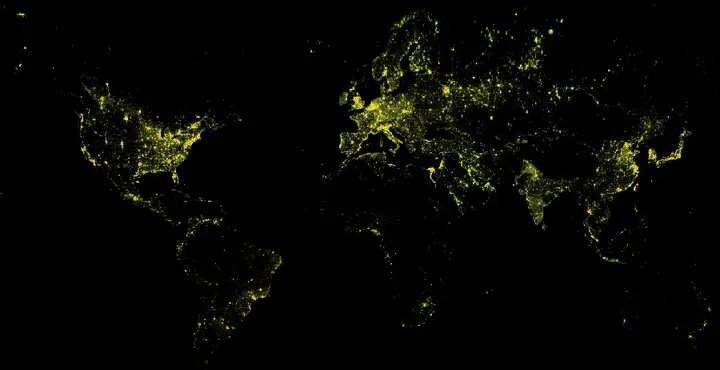 Photo by rawpixel on Unsplash
Night-time light (NTL) data has emerged as a valuable source of information for analyzing human activity patterns from the sky. NTL helps in understanding urbanization patterns, economic development, impact of disasters and finding hotspots of excessive night-light utilization. %The availability of high-resolution satellite imagery has enabled the study of NTL data at an unprecedented scale. However, the volume, complexity, and temporal dynamics of this data present challenges for visualization and analytics. To address these challenges, we introduce NightVIEW, an interactive tool for NTL data visualization and analytics that offers a comprehensive and user-friendly platform for researchers and stakeholders to explore and analyze NTL data. The tool is powered by an efficient system architecture to easily export and analyse huge volumes of spatial data (NTL) and computing components including image segmentation, clustering and change pattern detection to find urban development and sprawl patterns. The system is also capable to identify the temporal trends of NTL at different geographical region and captures the semantics of cities by exploring artificial light use at night. Specifically, NightVIEW helps in answering questions such as: What demographic factors influence NTL data and to what extent? Can we detect the boundaries of a city, urban area, or metropolitan area? How does it differ from the political boundaries and why? Where are the differences with demographic data unusual? We envision our tool, NightVIEW, as a companion for researchers in developing AI-based analytics as well as a guide for government stakeholders who can leverage the computing capacity of our modules to design policies and regulations related to NTL usage.
Shreya Ghosh
Postdoctoral Researcher (2021-2023)
My research interests include spatio-temporal data analytics and NLP (social media data analysis, low-resource language).